In Oracle, the standard way to calculate the difference (delta) between two values is using the LAG() analytic function.
For example… Suppose you’ve got a table of numeric values–
create table t as

select rownum id, value from v$sesstat where value > 0

/
select * from t;
ID              VALUE
---------- ----------
1                   1
2                   1
3                 967
4                  10
5                   3
6                  71
7               14649
8                 175
9                4517
10                207
...
Here’s how you calculate the delta between one value in the VALUE column and the value in the previous row:
select id, value,

value - lag(value) over(order by id) delta

from t

/
ID              VALUE      DELTA
---------- ---------- ----------
1                   1
2                   1          0
3                 967        966
4                  10       -957
5                   3         -7
6                  71         68
7               14649      14578
8                 175     -14474
9                4517       4342
10                207      -4310
...
OK, that seems pretty straightforward. I bring this up because I was using subquery factoring clauses (“WITH clause subqueries”) before I found out about analytic functions, so this is how I used to approach the problem of calculating deltas:
with v as (

select * from t

)

select

b.id,

b.value,

b.value - a.value delta

from v a, v b

where a.id = b.id-1

/
ID              VALUE      DELTA
---------- ---------- ----------
2                   1          0
3                 967        966
4                  10       -957
5                   3         -7
6                  71         68
7               14649      14578
8                 175     -14474
9                4517       4342
10                207      -4310
...
That method (joining a table to itself) is fairly inefficient. To demonstrate, I gathered stats for t …
exec dbms_stats.gather_table_stats(ownname=>user, tabname=>'t', estimate_percent=>100, cascade=>true);
…and executed each query (the one using LAG, and the one using WITH) after setting
set autotrace traceonly
Here’s the execution plan for the method using LAG:
---------------------------------------------------------------------------
| Id  | Operation          | Name | Rows  | Bytes | Cost (%CPU)| Time     |
---------------------------------------------------------------------------
|   0 | SELECT STATEMENT   |      |   826 |  6608 |     3  (34)| 00:00:01 |
|   1 |  WINDOW SORT       |      |   826 |  6608 |     3  (34)| 00:00:01 |
|   2 |   TABLE ACCESS FULL| T    |   826 |  6608 |     2   (0)| 00:00:01 |
---------------------------------------------------------------------------
…and here it is using the subquery factoring clause (WITH):
---------------------------------------------------------------------------
| Id  | Operation          | Name | Rows  | Bytes | Cost (%CPU)| Time     |
---------------------------------------------------------------------------
|   0 | SELECT STATEMENT   |      |   826 | 13216 |     5  (20)| 00:00:01 |
|*  1 |  HASH JOIN         |      |   826 | 13216 |     5  (20)| 00:00:01 |
|   2 |   TABLE ACCESS FULL| T    |   826 |  6608 |     2   (0)| 00:00:01 |
|   3 |   TABLE ACCESS FULL| T    |   826 |  6608 |     2   (0)| 00:00:01 |
---------------------------------------------------------------------------
But the remarkable thing is the change in consistent gets:
using LAG:       4
using WITH:     62
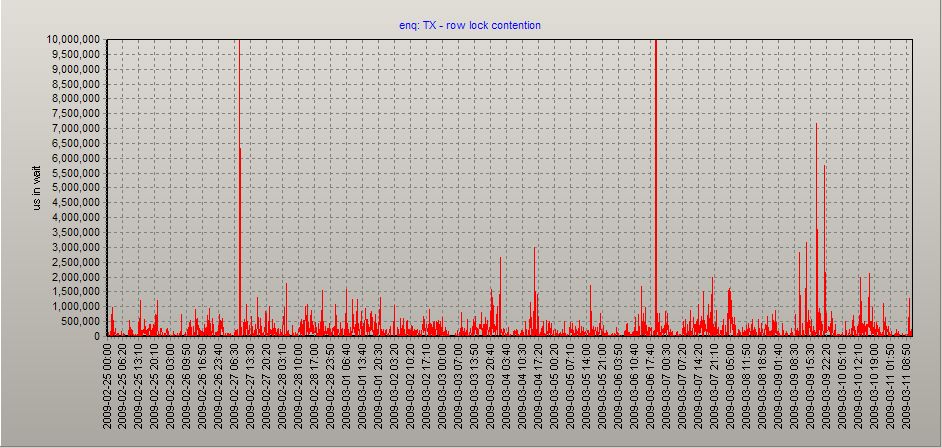
This is cool because you can use LAG to retrieve a graphable table of wait events from the AWR that make it easier to spot problems. For instance, you can retrieve the time waited for some wait event such as enq: TX – row lock contention
select

to_char(a.begin_interval_time,'YYYY-MM-DD HH24:MI') day,

nvl(b.time_waited_micro,0) - nvl(lag(b.time_waited_micro) over(order by a.snap_id),0) time_waited_micro

from dba_hist_snapshot a, dba_hist_system_event b

where a.snap_id = b.snap_id(+)

and upper(b.event_name)=upper('&event_name')

and a.begin_interval_time between trunc(sysdate-&num_days) and sysdate

order by a.snap_id

/
and then graph it, helping you visualize how row locks have affected your database over time:

