3 Normal Forms: Spanish Translation

I am happy to announce that my Three Normal Forms tutorial has been translated into Spanish by Roberto Fernandez. You can download it here.

Posted in Databases | Leave a comment

Ancient Treasure

In my apartment building people often leave books they no longer want in the lobby for others to pick up if they want. Usually it’s nothing interesting, but the other day someone left a truly incredible artifact: the Microsoft Excel Version 1.04 manual, from 1986.

This is a true historical document. It’s not the absolutely first version of Excel, but it’s almost the first. It includes the installation media (800KB floppy!) and it’s absolutely pristine. It feels like this thing belongs in a museum.

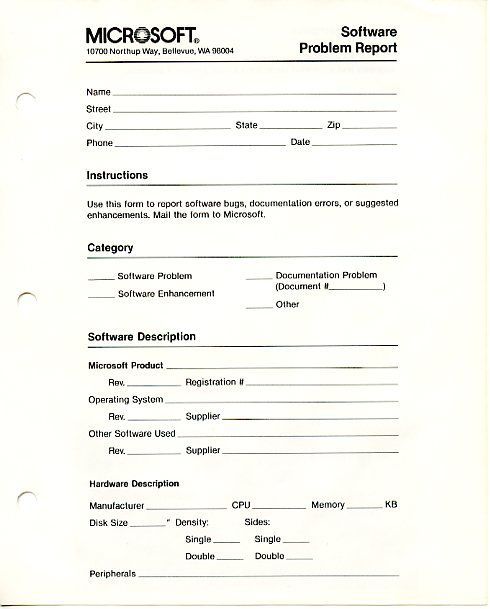
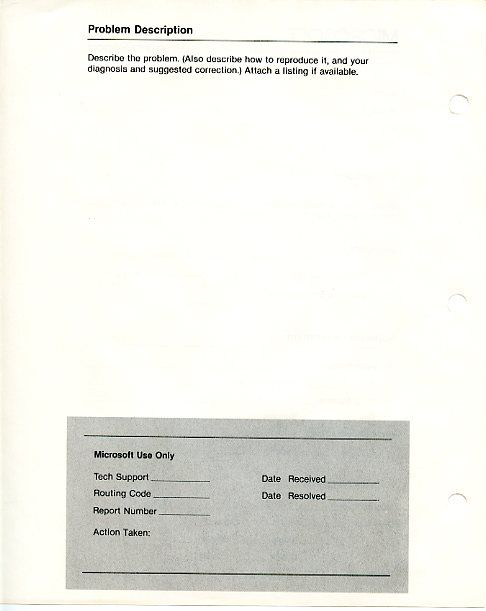
But the most interesting part is the very last page: a bug report form, for sending “software bugs, documentation errors, or suggested enhancements”. Best of all: Mail the form to Microsoft!

This thing is a treat. Shall we start the bidding at, say, $0.43?

excel-1

excel-2

Posted in Computers | 1 Comment

Debugging ORA-01001: invalid cursor

End-to-end performance tuning is something you hear more and more about. I have seen many presentations about how the “modern” DBA has to be intimately concerned with all layers of the application stack and cannot just focus on the database. I’m on board with that, but the reality is, I have rarely seen it in practice. The only time DBAs, developers, and netops folks seem to venture out of their silos is during crisis meetings and in emergency-situation chatrooms.

A case in point was when I was asked to troubleshoot an invalid cursor error on a client’s database. Here’s the helpful documentation Oracle provides for this error:

oerr ora 1001
01001, 00000, "invalid cursor"
// *Cause:
// *Action:

Hm. I guess that this is one of those things you’re just supposed to “know”. 🙂

Actually, invalid cursor is generally a problem with the application design. Perhaps the code is squandering resources and opening too many cursors. A common solution is to jack up the value of MAXOPENCURSORS. (Note that this is not an Oracle parameter as some people seem to think. It’s precompiler option. Meaning that you set this in a C header file and recompile your application in order to change it. But don’t ask me about this stuff; I’m a DBA, not a developer, remember?)

Well, there was no chance of throwing this problem back on the developers and saying “it’s your problem, fix it.” The application in this system is a black box, the source code is unavailable, and the vendor who wrote the software is long gone. Must be a pretty sweet time for the developers in this shop; they get to spend their days with their feet up or playing foosball. Thus it was up to us DBA-types to come up with a solution. Where to begin?

The error arose when a user of the application tried to change her password through the web interface. Our first thought was of course to look at the full error message, which provided the line in the code where the error arose:

09/20/2009 12:24:13 => User edit failed:
UserId=dolores
updateUser(): 62004
ORA-01001: invalid cursor
ORA-06512: at "APP_OWNER.SECURITY_CHECK", line 634
ORA-06512: at "APP_OWNER.SECURITY_CHECK", line 105
ORA-06512: at "APP_OWNER.USER_UPDATE_OPTIONS", line 2
ORA-04088: error during execution of trigger
'APP_OWNER.USER_UPDATE_OPTIONS'

The top point of failure (updateUser) was in the compiled app code, and inaccessible to us. But the rest of the stack was in the server-side PL/SQL code. The first of these (SECURITY_CHECK line 634) is a SELECT using CAST and MULTISET functions. What does that tell me? Well, I know that BULK COLLECT is often preferred over MULTISET because it involves fewer context switches between the SQL and PL/SQL engines… but that would be indicative of a CPU issue, and we seem to be dealing with a cursor cache memory issue here.

I have the client’s DBA try to recreate the error in the QA environment, but he can’t. That’s an interesting tidbit, but it’s not definitive because the QA and production environments are not (alas) completely identical. So there could be some configurable database parameter (shared pool? PGA?) that might help with this.

But rather than blindly start tweaking parameters, it’s time to look at what the user’s session is actually doing right up until the point of failure. I have my DBA buddy run the password update while I repeatedly query v$session but it goes by too fast; I am unable to identify his session amidst the regular user chatter (it’s not a terribly busy database, which is why I thought this might work). So I set up a logon trigger to capture user activity in a tracefile:

create or replace trigger enable_sql_trace after logon on database
begin
if( dbms_session.is_role_enabled('SQL_TRACE') )
then
execute immediate 'alter session set timed_statistics = TRUE';
execute immediate 'alter session set max_dump_file_size = unlimited';
dbms_monitor.session_trace_enable;
end if;
end;
/

Then I set up the SQL_TRACE role and assign it to the application user:

create role sql_trace;
grant sql_trace to app_user;

The DBA runs his update, gets the error, but… no new tracefile appears in USER_DUMP_DEST. So I turn off my trigger…

revoke sql_trace from app_user;
alter trigger enable_sql_trace disable;

…and I go back to to looking at v$session. Why was no new session created? I look at the INACTIVE sessions… say, there’s a whole bunch of APP_USER sessions here that have been logged in since… last March! That can only mean… Connection pool!

The DBA said yes, indeed, the app server runs a Resin connection pool in the middle tier. Well, case closed. We scheduled a restart of Resin, all the cursors that the app sessions had been hanging onto were freed, and the problem vanished (for the next 6 months or so, anyway).

My point is, I could have been a much more effective troubleshooter if I had known more about the architecture of the full application stack. Situations like this inspire me to get outside of my database box and ask more questions… but really, this kind of groping in the dark seems standard; I see it all the time.

See Note 1007395.6: Common Causes of ORA-01001 for more background on ORA-01001.

Posted in Databases | Leave a comment

Backup failure… One RMAN’s odyssey

Here’s a cautionary tale about not doing your homework first.

There’s this Oracle 10.2 database on a Windows 2003 server that I manage. I noticed a big hard drive attached to it that was just sitting there unused, so I asked the sysadmin if I could use it for RMAN backups, since they were starting to gradually consume more and more space. He said “sure.”

So I modified the backup script to use this new K: drive, but the next morning discovered the backup had failed with the following error:

RMAN-00571: ==================================================
RMAN-00569: ========= ERROR MESSAGE STACK FOLLOWS ============
RMAN-00571: ==================================================
RMAN-03009: failure of backup command on c1 channel at 07/21/2009 22:46:18
ORA-19502: write error on file 
  "K:\ORACLE\RMAN\PROD1\PROD1_4364_1_692830812_RMAN.DBF", 
  blockno 524545 (blocksize=8192)
ORA-27070: async read/write failed
OSD-04016: Error queuing an asynchronous I/O request.
O/S-Error: (OS 112) There is not enough space on the disk.
ORA-19502: write error on file 
  "K:\ORACLE\RMAN\PROD1\PROD1_4364_1_692830812_RMAN.DBF", 
  blockno 524161 (blocksize=8192)
ORA-27070: async read/write failed

Strange. I checked the disk; no files were there. Plenty of free space, though; over 400 GB (and the compressed backup size for this database is typically only 8 GB).

I reviewed the backup statistics recorded in v$rman_backup_job_details and found that the backup had failed after writing just 4,099 MB. It was also much slower than usual, running at 0.6 MB/s (usually it runs at 2.3 MB/s).

select
  (select instance_name from v$instance) || ' ' ||
    (select instance_number from v$instance) instance
  ,to_char(start_time,'yyyy-mm-dd hh24:mi') start_time
  ,to_char(output_bytes/1048576,'999,999,999.9') output_mb
  ,to_char(output_bytes_per_sec/1048576,'999,999.9') mb_S
  ,time_taken_display elapsed
  ,status
from v$rman_backup_job_details
order by start_time
/

INSTANCE   START_TIME        OUTPUT_MB MB_S  ELAPSED    STATUS
---------- ----------------- --------- ----- ---------- -------------
prod1 1    2009-07-18 21:00  8,846.5   2.3   01:02:59   COMPLETED
prod1 1    2009-07-19 21:00  8,852.6   2.3   01:04:08   COMPLETED
prod1 1    2009-07-20 21:00  8,921.5   2.3   01:04:51   COMPLETED
prod1 1    2009-07-21 21:00  4,099.0    .6   01:46:07   FAILED

Hmm, that 4,099 MB output size sounds fishy. Isn’t there something about a 4 GB file size limit on some Windows filesystems? How can I find out what filesystem is on that disk?

You could use the Disk Management snap-in (compmgmt.msc) but since GUIs are for sissies I use the DISKPART command-line utility:

d:\oracle\>diskpart

Microsoft DiskPart version 5.2.3790.3959
Copyright (C) 1999-2001 Microsoft Corporation.
On computer: ORASRV-1

DISKPART> list disk

Disk ###  Status      Size     Free     Dyn  Gpt
--------  ----------  -------  -------  ---  ---
Disk 0    Online        17 GB  4080 KB
Disk 1    Online        34 GB      0 B
Disk 2    Online        34 GB      0 B
Disk 3    Online       137 GB      0 B
Disk 4    Online       137 GB      0 B
Disk 5    Online        34 GB      0 B
Disk 6    Online        34 GB      0 B
Disk 7    Online       466 GB      0 B
Disk 8    Online       466 GB      0 B

DISKPART> select disk 8

Disk 8 is now the selected disk.

DISKPART> detail disk

WDC WD50 00AAKS-00YGA0 USB Device
Disk ID: D6232DTD
Type   : USB
Bus    : 0
Target : 0
LUN ID : 0

Volume ###  Ltr  Label        Fs     Type        Size     Status     Info
----------  ---  -----------  -----  ----------  -------  ---------  --------
Volume 3     K   HD-W983      FAT32  Partition    466 GB  Healthy

Aha. K: is a FAT32. And the file size limit for FAT32 is 4 GB (or actually, (2^32)-1 bytes, which is 4 GB minus one byte).

OK, that explains why the backup failed. I can workaround that by tweaking my RMAN configuration so that it creates files no bigger than 4 GB-1, right?

RMAN> configure maxsetsize to 4294967295;

But wait… Is that something I really want to do? Take another look at that DISKPART output. The K: drive is USB. Dang. So that’s why the backup went so slow!

OK, that does it then. That K: drive is completely unsuitable for any Oracle-related purpose. If you have Metalink access you can read more about problems using USB drives with Oracle in Note 604494.1: Errors backing up to a USB disk device. Basically the slowness of the USB writes causes Oracle to fill up the memory buffer before it can get emptied, and the operating system winds up killing the Oracle process to protect itself. I should have taken a closer look at this disk before even attempting to use it for the Oracle backup.

The moral of the story: always look a gift horse in the mouth.

Posted in Databases | 2 Comments

What happened to my automatic instance recovery?

Yesterday I had to shutdown a production reporting database (Oracle version 10.2.0.4) so they could add RAM to the server. The shutdown immediate wasn’t going fast enough to suit me, so I logged into a second session and issued a shutdown abort. “No problem,” I thought. I already had permission to kill whatever sessions were running, and SMON will automatically perform instance (crash) recovery and clean things up when I open the database later, right?

A few minutes later I got the green light to restart the database, and instead of a clean start, the startup halted after it got to MOUNT:

Total System Global Area 6442450944 bytes
Fixed Size 2093584 bytes
Variable Size 2030046704 bytes
Database Buffers 4378853376 bytes
Redo Buffers 31457280 bytes
Database mounted.
ORA-01113: file 1 needs media recovery
ORA-01110: data file 1:
'/u02/oradata/PROD/foo/DATA/system01.dbf'

Hmm, that’s odd. This is supposed to happen automatically. You get this kind of message when something bad has happened to the online redologs or the datafiles are damaged, and I can feel a cold lump start to form in the pit of my stomach… But no, the redologs are fine.

Well OK then, whatever

SQL> alter database recover datafile 1;

…but then it asks me to recover datafile 2. Obviously, many datafiles are in an inconsistent state. So I issue

SQL> recover database;

Oracle seems happy about that, and in a couple of minutes I am able to open the database.

SQL> alter database open;

Database altered.

But my question was, why did I have to go through this in the first place? Recovery (rolling throught the online redologs) is something that is supposed to happen automatically when you open the database after abnormal termination (a crash or abort). That’s one of the functions of the SMON process. What happened this time?

A clue was found in the alert log, just before I did my shutdown immediate:

Thu Jul 9 14:47:56 2009
Completed: ALTER DATABASE BEGIN BACKUP
Thu Jul 9 14:47:57 2009
Shutting down instance (immediate)

Backup? Why is there a backup taking place? We use RMAN to do backups, and RMAN does not use alter database begin backup, and anyway this is not the backup window.

Ahhh, right. We’re using NetApp’s SnapManager feature in addition to regular RMAN backups. Every hour the NetApp filer takes a snapshot of the Oracle datafiles, and must put them into backup mode first to keep the headers consistent. OK, that explains the BEGIN BACKUP. How is that relevant here?

The answer is that if you do a shutdown abort while any tablespaces are in backup mode, the DBA must manually take those tablespaces out of backup mode before the database will open. In other words, no automatic instance recovery.

I tried this out on my test system, and discovered that in 11g Oracle has improved the error message slightly to help dimwits like me figure out what’s going on:

ORA-10873: file 1 needs end backup before opening a database

…instead of the slightly puzzling

ORA-01113: file 1 needs media recovery

Further explication can be found here:

http://download.oracle.com/docs/cd/B19306_01/backup.102/b14191/osbackup.htm#i1006393

Posted in Databases | Leave a comment

v$osstat anomaly

The v$osstat view shows certain OS-level metics such as number of CPUs, current system load, accumulated IO time, etc. Starting in 10gR2, it also records PHYSICAL_MEMORY_BYTES, which is the total size of physical memory on the server. See the documentation.

I think I found an anomaly. On one particular database I take care of (version 10.2.0.3 running on RedHat 4 64-bit), PHYSICAL_MEMORY_BYTES appears to be the amount of free memory available on the system, not total memory size like it says in the docs.

On that system, if I run the following two commands from within sqlplus —

SQL> ho cat /proc/meminfo |grep ^MemFree |tr -s ' ' |cut -d' ' -f2
SQL> select value from v$osstat
  where stat_name='PHYSICAL_MEMORY_BYTES';

…the results are really, really close. Less than a few dozen bytes apart. This leads me to believe that on this particular database, v$osstat is getting its value for PHYSICAL_MEMORY_BYTES from free memory, not from total memory.

DBA_HIST_OSSTAT tracks this value over time. It should not change unless you are changing the amount of installed memory on your server. But here is how PHYSICAL_MEMORY_BYTES changes on my RHEL4 64-bit 10.2.0.3 system:

select * from (
  select snap_id, value
    , value-lag(value) over(order by snap_id) delta
  from dba_hist_osstat
  where stat_name='PHYSICAL_MEMORY_BYTES'
  order by snap_id
) where rownum <= 50
/
   SNAP_ID      VALUE      DELTA
---------- ---------- ----------
     28389    2220048
     28390    2171328     -48720
     28391    1938152    -233176
     28392    2131860     193708
     28393    2123272      -8588
     28394    2097128     -26144
     28395    2070008     -27120
     28396    2068092      -1916
     28397    2076164       8072
     28398    2059132     -17032
     28399    2045440     -13692
     28400    2037288      -8152
...

A 10.2.0.4 database installed on identical hardware/OS reports no change in PHYSICAL_MEMORY_BYTES:

   SNAP_ID      VALUE      DELTA
---------- ---------- ----------
     29125 8359936000
     29126 8359936000          0
     29127 8359936000          0
     29128 8359936000          0
     29129 8359936000          0
     29130 8359936000          0
     29131 8359936000          0
     29132 8359936000          0
     29133 8359936000          0

…so I am tempted to suppose that this is a 10gR2 bug that was fixed in 10.2.0.4. However, I checked on a 10.2.0.2 database running on Windows, and there is no anomaly:

  SNAP_ID      VALUE      DELTA
--------- ---------- ----------
    43747 4093104128
    43748 4093104128          0
    43749 4093104128          0
    43750 4093104128          0
    43751 4093104128          0
    43752 4093104128          0
    43753 4093104128          0
    43754 4093104128          0
    43755 4093104128          0
    43756 4093104128          0
    43757 4093104128          0

It appears that this is either a Linux-specific bug that was fixed in 10.2.0.4, or perhaps a bug that only occurs in 10.2.0.3 (I don’t have a 10.2.0.3 database running on Windows to test this out on). However, I could find no mention of this as a bug on Metalink.

Posted in Databases | Leave a comment

cursor: pin S wait on X

I had a little excitement with the cursor: pin S wait on X wait event when a client’s website came grinding to a halt.

The first thing I checked was blocking sessions…

col username form a12
col event form a25 word_wrapped
col blocking_session head "BLOCKING|SID"
select sid, username, event, blocking_session,
seconds_in_wait, wait_time
from v$session
where state = 'WAITING'
and wait_class != 'Idle'
/

…but there were none (i.e. the BLOCKING_SESSION column was empty). There were, however, a large number of sessions engaged in cursor: pin S wait on X waits.
I took down a few SIDs and ran this query to find out what SQL they were executing:

col sql_text form a150 word_wrap
col child_number head CH# for 999
select
sid,  hash_value,
child_number,
sql_text
from v$sql
where hash_value in (select sql_hash_value from v$session where sid in (&sid))
/

They were all executing the same PL/SQL package. I checked out that package–


select status,
to_char(last_ddl_time, 'yyyy-mm-dd hh24:mi') last_ddl_time
from dba_objects
where upper(owner)=upper('&own')
and upper(object_name) = upper('&name')
/

…and discovered that it had last been modified 15 minutes ago. At that point the site’s DBA came online and he informed me that he had recompiled the package and then had been called away to an unrelated emergency.

Hmm, rolling out untested code on a production server? Grrr… Well, no time for that now; we had to get the website unstuck. He fixed the code and recompiled it, but this did not release those cursor: pin S wait on X waits.

Instead of killing each session one by one (there were dozens of them), I identified the root blocker, whose SID is embedded in the p2raw column of v$session:


select p2raw, count(*)
from v$session
where event = 'cursor: pin S wait on X'
group by p2raw
/
P2RAW            COUNT(*)
---------------- --------
0000028100000000 76
000001EF00000000  3

I went for 0000028100000000 since it had the most sessions. The SID of the blocker is embedded in the first 8 bytes of that string– 281 (hexadecimal). Converted to decimal, the SID is 641.We killed that session…

select serial# from v$session where sid=641;
17938
alter system kill session '641,17938';

…and all the cursor: pin S wait on X waits evaporated and the site sprang to life.
So obviously, this was a blocking situation. Why didn’t my original query, the one that checked for blocking sessions, identify any blockers?

It’s because of a bug in Oracle 10g: the v$session.blocking_session column does not get populated in the case of cursor: pin S wait on X waits. This has apparently been fixed in 11g.

There are a number of bugs pertaining to this wait event. They didn’t apply here, since our smoking gun was our own buggy code. Check out Asif Momen‘s blog for further references.

Posted in Databases | Leave a comment

Testing disk I/O with the O_DIRECT flag

Sometimes I find the need to test disk IO rates, especially in the context of one of those delightful intra-office debates where the DBAs are blaming the lousy hardware for bad database performance and the sysadmins are blaming the lousy database.

You can perform a simple test of disk IO using the dd command. First, create a 1 GB file full of zeros:

dd if=/dev/zero of=1G bs=1024k count=1024

Then scan and time it…

time dd if=1G of=/dev/null bs=1024k count=1024

…and then use the output from that to calculate your MB/s.

This technique is flawed because it does not account for OS-level caching, which can give a sigificant boost to IO. The Linux 2.4 kernel allows programs to disable this caching by setting the O_DIRECT flag. Starting in Oracle 9.2 you can use this feature by setting the FILESYSTEMIO_OPTIONS init parameter to DIRECTIO or SETALL. (Direct IO is a controversial subject in the Linux community but Oracle has built significant functionality around it).

Therefore, if Oracle does not use OS-level caching (i.e. FILESYSTEMIO_OPTIONS is set to DIRECTIO or SETALL) , the results you get from the dd test will not be representative for your Oracle database.

The standard dd command does not provide a way to set the O_DIRECT flag (I think this has changed in RHEL5), but Oracle provides a free replacement for the standard Linux coreutils package, which contains the dd and cp commands. The folks at Oracle so generously provided this replacement package to help us debug Clusterware problems, but it can be used for other tasks as well. The replacement can be found at http://oss.oracle.com/projects/coreutils/files/

Oracle has not updated their “official” coreutils package since RHEL3, but there is an updated unofficial version for RHEL4 here: http://oss.oracle.com/~smushran/.coreutils/RHEL4-i386/

I was told that the RHEL3 version would work fine with Centos 4 (and, presumably, RHEL4), but the package installer complained about missing dependencies when I tried to force-install it, so rather than risk breaking something on a production server I sought a different solution.

I downloaded Robin Miller’s dt utility http://www.scsifaq.org/RMiller_Tools/index.html and this provided O_DIRECT functionality. To use it, simply unzip the archive for your platform and then move the single dt executable to your system path (or execute it directly from the unzip folder; it requires no special installation).

dt allows you to create a big file similar to one created by dd; then it will scan that file and calculate the transfer rate for you.

When you run dt in output mode, it performs both a write and a read test:

$ dt of=1G limit=1g bs=1m dispose=keep flags=direct

Write Statistics:
Total records processed: 1024 @ 1048576 bytes/record (1024.000 Kbytes)
Total bytes transferred: 1073741824 (1048576.000 Kbytes, 1024.000 Mbytes)
Average transfer rates: 29059319 bytes/sec, 28378.241 Kbytes/sec
Number I/O's per second: 27.713
Total passes completed: 0/1
Total errors detected: 0/1
Total elapsed time: 00m36.95s
Total system time: 00m00.19s
Total user time: 00m06.30s

Read Statistics:
Total records processed: 1024 @ 1048576 bytes/record (1024.000 Kbytes)
Total bytes transferred: 1073741824 (1048576.000 Kbytes, 1024.000 Mbytes)
Average transfer rates: 50840048 bytes/sec, 49648.485 Kbytes/sec
Number I/O's per second: 48.485
Total passes completed: 1/1
Total errors detected: 0/1
Total elapsed time: 00m21.12s
Total system time: 00m00.13s
Total user time: 00m10.08s

Total Statistics:
Output device/file name: 1G (device type=regular)
Type of I/O's performed: sequential (forward)
Data pattern read/written: 0x39c39c39
Total records processed: 2048 @ 1048576 bytes/record (1024.000 Kbytes)
Total bytes transferred: 2147483648 (2097152.000 Kbytes, 2048.000 Mbytes)
Average transfer rates: 36980948 bytes/sec, 36114.207 Kbytes/sec
Number I/O's per second: 35.268
Total passes completed: 1/1
Total errors detected: 0/1
Total elapsed time: 00m58.07s
Total system time: 00m00.32s
Total user time: 00m16.38s
Starting time: Fri Nov 14 15:09:12 2008
Ending time: Fri Nov 14 15:10:10 2008

When you run it in input mode, it performs just a read test:

$ dt if=1G limit=1g bs=1m dispose=keep flags=direct

Total Statistics:
Input device/file name: 1G (device type=regular)
Type of I/O's performed: sequential (forward)
Data pattern read: 0x39c39c39
Total records processed: 1024 @ 1048576 bytes/record (1024.000 Kbytes)
Total bytes transferred: 1073741824 (1048576.000 Kbytes, 1024.000 Mbytes)
Average transfer rates: 55290516 bytes/sec, 53994.645 Kbytes/sec
Number I/O's per second: 52.729
Total passes completed: 1/1
Total errors detected: 0/1
Total elapsed time: 00m19.42s
Total system time: 00m00.09s
Total user time: 00m09.30s
Starting time: Fri Nov 14 15:10:38 2008
Ending time: Fri Nov 14 15:10:57 2008

Try running it without the flags=direct argument, and you will notice a significant difference in these stats.

See also:

Posted in Databases | Leave a comment

Calculating the delta between two row values

In Oracle, the standard way to calculate the difference (delta) between two values is using the LAG() analytic function.

For example… Suppose you’ve got a table of numeric values–

create table t as
select rownum id, value from v$sesstat where value > 0
/

select * from t;

ID              VALUE
---------- ----------
1                   1
2                   1
3                 967
4                  10
5                   3
6                  71
7               14649
8                 175
9                4517
10                207
...

Here’s how you calculate the delta between one value in the VALUE column and the value in the previous row:

select id, value,
value - lag(value) over(order by id) delta
from t
/

ID              VALUE      DELTA
---------- ---------- ----------
1                   1
2                   1          0
3                 967        966
4                  10       -957
5                   3         -7
6                  71         68
7               14649      14578
8                 175     -14474
9                4517       4342
10                207      -4310
...

OK, that seems pretty straightforward. I bring this up because I was using subquery factoring clauses (“WITH clause subqueries”) before I found out about analytic functions, so this is how I used to approach the problem of calculating deltas:

with v as (
select * from t
)
select
b.id,
b.value,
b.value - a.value delta
from v a, v b
where a.id = b.id-1
/

ID              VALUE      DELTA
---------- ---------- ----------
2                   1          0
3                 967        966
4                  10       -957
5                   3         -7
6                  71         68
7               14649      14578
8                 175     -14474
9                4517       4342
10                207      -4310
...

That method (joining a table to itself) is fairly inefficient. To demonstrate, I gathered stats for t
exec dbms_stats.gather_table_stats(ownname=>user, tabname=>'t', estimate_percent=>100, cascade=>true);

…and executed each query (the one using LAG, and the one using WITH) after setting
set autotrace traceonly

Here’s the execution plan for the method using LAG:

---------------------------------------------------------------------------
| Id  | Operation          | Name | Rows  | Bytes | Cost (%CPU)| Time     |
---------------------------------------------------------------------------
|   0 | SELECT STATEMENT   |      |   826 |  6608 |     3  (34)| 00:00:01 |
|   1 |  WINDOW SORT       |      |   826 |  6608 |     3  (34)| 00:00:01 |
|   2 |   TABLE ACCESS FULL| T    |   826 |  6608 |     2   (0)| 00:00:01 |
---------------------------------------------------------------------------

…and here it is using the subquery factoring clause (WITH):

---------------------------------------------------------------------------
| Id  | Operation          | Name | Rows  | Bytes | Cost (%CPU)| Time     |
---------------------------------------------------------------------------
|   0 | SELECT STATEMENT   |      |   826 | 13216 |     5  (20)| 00:00:01 |
|*  1 |  HASH JOIN         |      |   826 | 13216 |     5  (20)| 00:00:01 |
|   2 |   TABLE ACCESS FULL| T    |   826 |  6608 |     2   (0)| 00:00:01 |
|   3 |   TABLE ACCESS FULL| T    |   826 |  6608 |     2   (0)| 00:00:01 |
---------------------------------------------------------------------------

But the remarkable thing is the change in consistent gets:

using LAG:       4
using WITH:     62

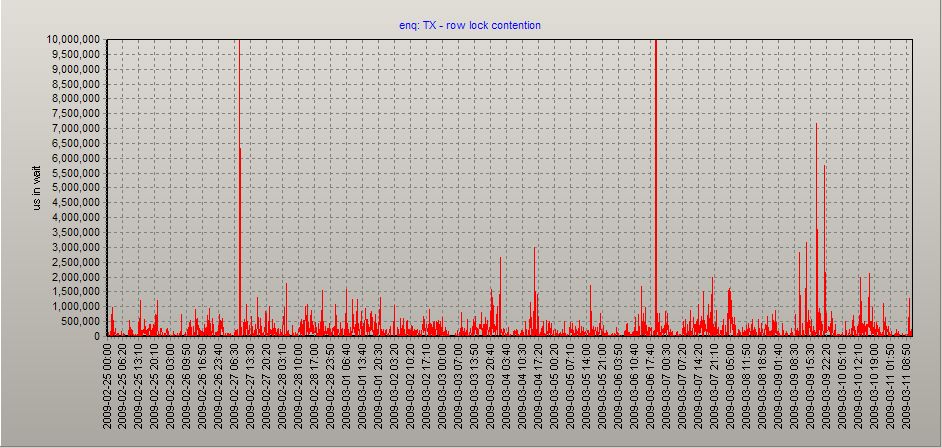
This is cool because you can use LAG to retrieve a graphable table of wait events from the AWR that make it easier to spot problems. For instance, you can retrieve the time waited for some wait event such as enq: TX – row lock contention

select
to_char(a.begin_interval_time,'YYYY-MM-DD HH24:MI') day,
nvl(b.time_waited_micro,0) - nvl(lag(b.time_waited_micro) over(order by a.snap_id),0) time_waited_micro
from dba_hist_snapshot a, dba_hist_system_event b
where a.snap_id = b.snap_id(+)
and upper(b.event_name)=upper('&event_name')
and a.begin_interval_time between trunc(sysdate-&num_days) and sysdate
order by a.snap_id
/

and then graph it, helping you visualize how row locks have affected your database over time:

enq: TX - row lock waits

Posted in Databases | Leave a comment

Removing a collar from a feral cat

I recently got a feral cat (Max) from a shelter in Brooklyn to be integrated into my local cat colony. Unfortunately Max came with a plastic ID collar that the shelter people had put on him during his incarceration at the pound, and obviously this collar had to come off before I let Max out into my colony (if he got it caught on a branch he could choke to death).

So the challenge was, How to remove a collar from a feral cat that is wild, terrified of humans, and cannot be touched except under sedation?

Here’s what I did (after getting some advice from Bryan Kortis at Neighborhood Cats):

First I raised Max’s cage up on blocks so that there was about a half-inch of space beneath it. This allowed the forks of a trap divider to go down through the floor of the trap, “locking” it in place.

Divider clearance

My plan was to confine Max in as small a space as possible on the “square” end of the trap (not the tapered end), so that I would have easier access to him.

Confinement space

With the first trap divider in place, I gently nudged and prodded him into the confinement space using the other divider. Fortunately he was more stubborn than violent so all I needed was a bit of patience.

Squished cat 1

Max was not very pleased with this at all.

Squished cat 2

Next I slid a quarter-inch diameter wooden dowel down into the cage, through Max’s collar, and through the bottom of the cage.

Dowel
This effectively “locked” him in place, making it easier to access the collar, and making it less likely to injure him in the process of cutting the collar, which came next:Scissors

Here I was able to reach a pair of scissors in between the bars of the trap and make the cut. This was why I chose the square end of the trap: depending on where Max had chosen to position his body, being at that end of the trap gave me more options for getting at the collar. If necessary, I could even have opened the trap’s front door and reached in between the bars of the divider, which are wider than the trap’s bars.

And here, the collar is cut.

Cut

Voilà.

Posted in Cats | 3 Comments